
Marketers have more access to more data than ever before. How many times have you received an automated email or a slide deck with scores of numbers, tables, charts, and graphs from the multitude of the MarTech apps and platforms that you use – but no words? This data is so valuable; yet, without a story, they can quickly become meaningless, almost blurring together.
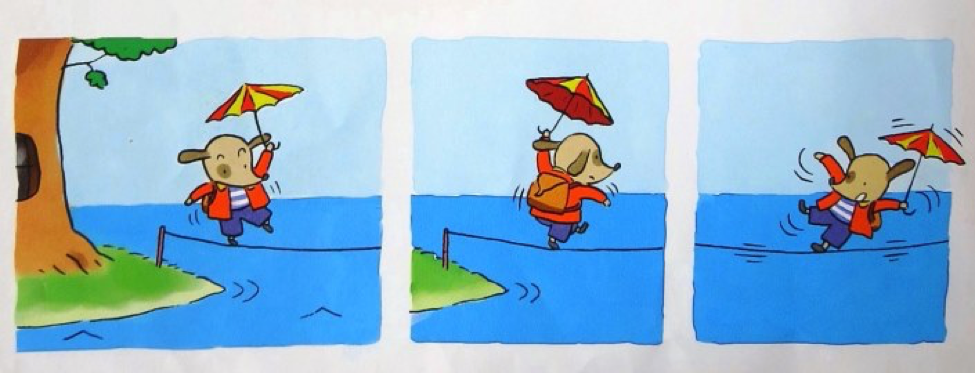
These bring to mind a series of children’s books about a little dog named Polo “written” by Régis Faller starting in 2000 (great gifts for young kiddos, by the way). Polo has a bottomless backpack of tools and tricks, interesting acquaintances, and many remarkable places to go. The books are in fact a series of illustrations, much like a comic strip, with no words – the story is all yours to tell.
As an analytical marketer, you have much the same task. As amazing as they are, none of our systems can tell the story about your data. Where have you been? What happened along the way and why? Where will you go next? Take a look at your data and unleash your imagination. What do you see?
- Compare your metric to another. Given a metrics or a chart, ask yourself how it compares to others. Is it good? Bad? Indifferent? Has it gotten better or worse over time? Does it meet a target? Or a benchmark? Is there a major outlier in the data? Once you have some of these answers, you’ll invariably lead to the next question: why do I see this?
- Look for intersections between data. Is there another related dataset that supports your hypothesis? Was there an event within or external to your business that might have influenced your results? What happened before that intersection? After?
- Plan an action. What can you do to take advantage of this result? A good story always has a start, middle, and end – what’s your conclusion? Consider your audience: what do they care most about?
Let’s put this into practice with a very simple example:
The Report:
| Month | MQLs | Attainment |
| March | 2,000 | 5% over target |
The Story: We were awarded speaking slots at two targeted conferences, which drove an increase in website traffic and therefore website form submissions. This increase in volume at the top of the funnel resulted in beating our target MQLs, all other conversion activities remaining the same. We’re tracking these MQLs through the remainder of the funnel; if we see a strong ROI, we plan to request budget for next year to increase our participation in these conferences.
Your stories don’t need to be novels; you just need to fill in the blanks that your systems or even business intelligence platforms can’t. But beware, because there may be a few traps along the way to avoid:
- Correlation is not always causation. Just because something happened at the same time doesn’t mean it actually caused the result you see. Back up your assumptions with additional datasets.
- Don’t exclude data that doesn’t support your hypothesis. It’s easy to develop preconceived notions going into an analysis; after all, you had a specific endgame in mind when crafting your campaign.
- Don’t point fingers. If your story reaches an uncomfortable conflict, develop your plan to find the “happily ever after” by addressing and mitigating those risks.
Intersecting data and storytelling can be a fun exercise, like “reading” a Polo story with a child. Given the powerful tools we have and reams of data, it’s very easy to create pleasing visualizations, but the true challenge lies in bringing the story to life. All humans, whether adults or children, love the art and emotion of stories. Practice developing this skill and you’ll find yourself armed to influence or make much better business decisions in our increasingly data-driven world of marketing.
 Gaea Connary serves as Manager of Agile Transformation at BDO Digital. She is continually fascinated by creativity and agility in developing marketing technology, and has helped many organizations revitalize their marketing efforts with hands-on guidance and innovative tech applications.
Leave a Reply